
Net Promoter Score Survey
In Brief
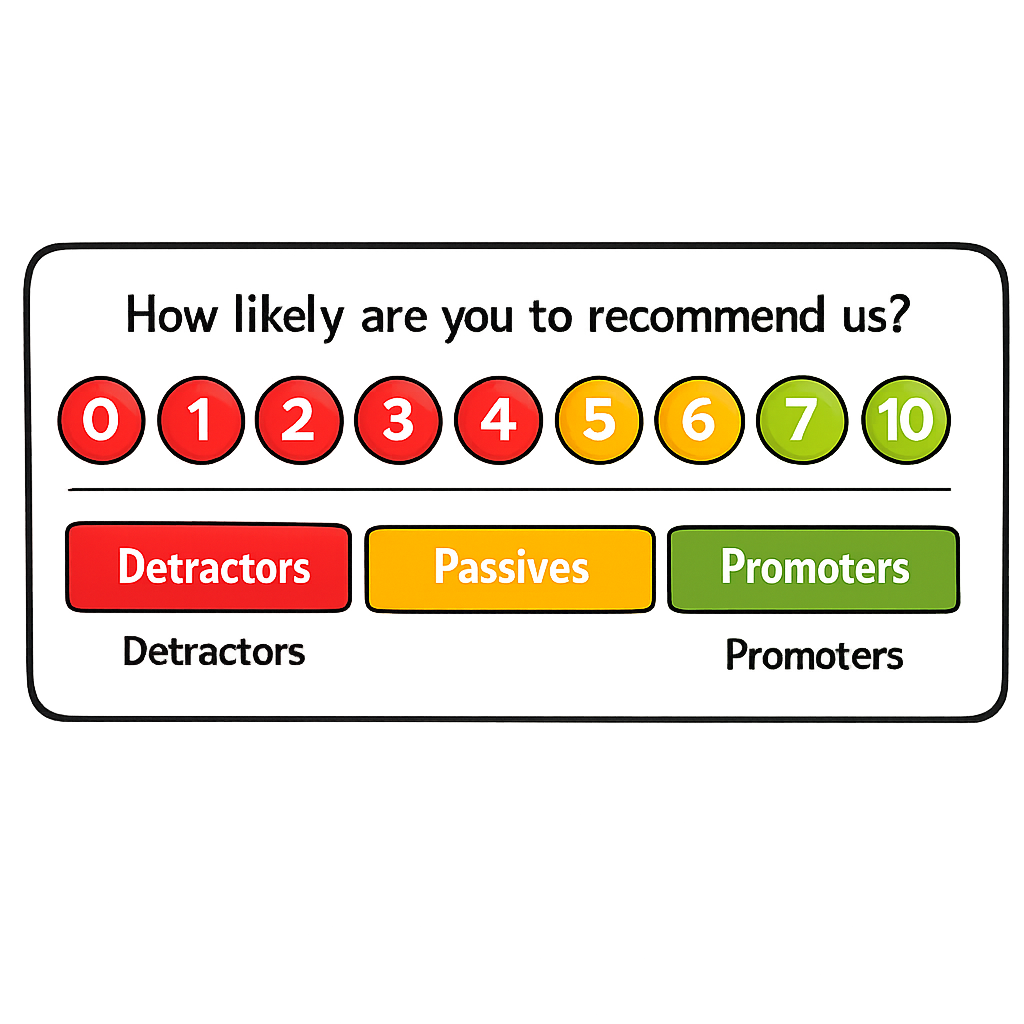
A Net Promoter Score (NPS) survey is a single-question loyalty measurement that asks customers to rate, on a scale from 0 to 10, how likely they are to recommend your product or company to a friend. Respondents are grouped into Promoters (9-10), Passives (7-8), and Detractors (0-6), and the final NPS is calculated by subtracting the percentage of Detractors from the percentage of Promoters. The output is a trackable score you can repeat over time to measure whether satisfaction is improving, plus optional follow-up answers that explain the reasons behind each rating.
Common Use Case
You launched a new feature three months ago and want to know whether your customers are happy enough to tell their friends about it. You need a simple, repeatable way to measure loyalty over time and figure out which customers are your biggest fans and which ones might leave.
Helps Answer
- How loyal are our customers to this product?
- Which customers would recommend us to a friend?
- How do different customer groups feel about our product?
- Are customers becoming more or less satisfied over time?
Description
NPS tracks loyalty and identifies the ambassadors among your customers. Fred Reichheld introduced it in his 2003 Harvard Business Review essay “The One Number You Need to Grow,” arguing that a single “would you recommend” question tracked company growth more reliably than the long satisfaction batteries that preceded it.
The mechanic is fixed. Ask “How likely is it that you would recommend [company / product] to a friend or colleague?” on a 0–10 scale, then bucket respondents into Promoters (9–10), Passives (7–8), and Detractors (0–6). The score is %Promoters − %Detractors. Bain & Company, where Reichheld developed the system, reports that loyalty leaders grow at more than twice the rate of competitors over the long run.
The NPS is just an anchor; the value comes from the open-ended why follow-up. The verbatims are where the actionable themes live — what promoters praise, what detractors want fixed.
NPS is a lagging indicator: it measures past satisfaction, not future behavior. Pair it with behavioral data — usage, churn risk, actual referral activity — to check whether promoters are genuinely driving growth. Reichheld himself has warned that NPS programs collapse into a “tragedy of the commons” when teams chase the score for bonuses instead of acting on the feedback.
How to
Prep
-
Write down why you’re sending this NPS. “Track quarterly trend,” “find detractors before they churn,” and “benchmark against competitors” require different cadences and follow-up workflows. If you can’t name the decision the score will inform, you’re not ready to field it.
-
Decide who to survey. Pull the list from your CRM or product analytics, filtering for users past onboarding and active recently enough to have a real opinion. Aim for at least 30 responses; if your user base is small, survey everyone who qualifies.
-
Decide cadence. Pick one and commit. Relationship NPS surveys the same cohort every 90 or 180 days and tracks the trend of overall loyalty. Transactional NPS is triggered by a specific event (purchase, support ticket close, feature first-use) and diagnoses which moments produce promoters and which produce detractors. Running both at once without segmentation muddies the signal.
-
Write the survey. The core question is standardized — don’t change it:
- “How likely are you to recommend [product] to a friend or colleague?” (0 = Not at all likely, 10 = Extremely likely)
- Add one open-ended follow-up: “What is the primary reason for your score?”
- Optionally: “What could we do to improve your experience?”
-
Plan the close-the-loop workflow before you send. Decide who will contact every detractor and within what window (Bain’s standard is 24–48 hours). If nobody is on the hook to respond, don’t run the survey — collecting feedback you won’t act on burns goodwill with customers most likely to be saved.
Execution
-
Pick your distribution channel.
- Email (most common): Short message, 2–3 sentences, subject line like “Quick question about [product].”
- In-app (higher response rate): Trigger after the user completes a key action. Tools like Sprig and Hotjar make this easy.
- Post-interaction: Send immediately after a support ticket is resolved or a key milestone is reached.
-
Send and wait. Give respondents 5–7 days to reply. Send one reminder after 3 days. Expect a 10–30% response rate for email and higher for in-app or post-interaction triggers.
-
Close the loop on detractors within 24–48 hours. Bain calls this the most important step in the system, and it’s the part most teams skip. A real human contacts every detractor (0–6) to understand their specific issues. AI-powered platforms can automate the routing (detractors to support, passives to re-engagement, promoters to referral programs), but the human conversation with the detractor is non-negotiable.
-
Don’t argue with the score. When a detractor explains their reason, listen and capture; don’t defend the product. The verbatim is the data — debating it teaches the customer to stop responding.
Analysis
The original NPS calculation, per Reichheld and Bain, subtracts the percentage of Detractors from the percentage of Promoters and ignores Passives:
NPS = % of Promoters – % of Detractors
A single score doesn’t mean much on its own. Anchor it three ways:
- Against your prior wave. A 5-point movement across consecutive quarterly waves with the same cohort and same instrument is real signal. Smaller moves sit inside the noise floor.
- Against industry benchmarks. Per CustomerGauge’s 2025 SaaS NPS benchmark roundup, median SaaS NPS sits around +36, with top performers like Nutanix (92), Zoom (72), and Google (58) well above. Treat vendor-published benchmarks as directional anchors, not targets — they’re self-reported.
- Against behavior. Cross-tabulate NPS bracket against retention, expansion, and referral activity in your own data. If your promoters don’t actually retain or refer at higher rates than your passives, the score is decorative.
The open-ended “why” is where the actionable insight lives. Bucket verbatims by score bracket and look for repeated language: what promoters praise tells you what’s working; what detractors repeatedly complain about tells you what to fix first.
AI tools like Dovetail, MonkeyLearn, and the built-in analytics in Qualtrics can auto-categorize hundreds of verbatims into themes and surface the most common reasons behind each bracket — reducing manual analysis from days to hours. Focus your human attention on the outliers and ambiguous responses the AI flags rather than reading every response individually. Then use AI to correlate NPS scores with behavioral data — usage frequency, churn risk, referral actions — to verify your promoters are genuinely driving growth.
- Selection-timing bias Sending the NPS survey shortly after a positive event (a successful onboarding, a closed support ticket, a new release) inflates the score; sending after a negative event deflates it. Pick a consistent trigger (e.g., 30 days after first paid month) and stick to it so scores are comparable over time.
- Sample composition bias Non-respondents are not represented. The customers most likely to respond are usually your strongest promoters and most active detractors; passives skip surveys. The headline NPS over-weights the loud edges. Track response rate alongside the score, and check for systematic gaps (e.g., enterprise tier 50% response, free tier 5%).
- Cultural-scoring bias Cultures vary in their willingness to use the high end of the 0–10 scale. Western European and Japanese respondents systematically rate lower than US respondents on identical experiences; some Asian markets cluster around the middle. Compare segments only within consistent geographic groupings, and use change-over-time within a region rather than absolute scores across regions.
- Detractor self-selection A vocal minority of detractors will respond, write extensively, and dominate the verbatim analysis even when they represent a small share of the customer base. Weight detractor commentary by their actual proportion of the response set, and contrast against silent-majority behavior (usage, retention) before reorganizing the roadmap around their complaints.
- Response fatigue Long surveys with multiple questions before the NPS item lower the score by 5–10 points, because tired respondents are less generous. Keep the NPS question first and limit the follow-up to one open-ended prompt. If you embed NPS in a longer survey, accept that the score is not comparable to standalone NPS.
- AI-generated open-ended response bias A growing share of free-text NPS responses are now AI-generated by respondents themselves (autocomplete, AI assistants drafting on their behalf). Templated responses look thoughtful but carry less signal than authentic verbatim. Watch for responses that are unusually well-structured, use generic SaaS-vendor language, or repeat across customers — and triangulate against behavior rather than treating verbatim alone as evidence.
- Lagging-indicator overconfidence NPS measures past satisfaction, not future behavior. A high NPS this quarter does not predict next quarter’s churn or referral activity on its own. Pair NPS with leading behavioral indicators (usage frequency, feature depth, expansion) before treating the score as a forecast.
Learn more
Case Studies
Apple Retail
Store managers personally called every detractor within 24 hours of a low NPS score. As reported in The Ultimate Question 2.0 (Reichheld & Markey, 2011), the closed-loop program generated an estimated $25 million in additional annual sales — the canonical example of why the close-the-loop step is non-negotiable.
Charles Schwab
Bain documents Schwab as an early example of NPS used for executive accountability: detractor calls routed to senior staff, root causes tracked back to specific products and policies, with the resulting changes credited for measurable retention improvements.
Taylor & Hart
The London jeweler used NPS as their “One Metric That Matters,” systematically acting on promoter and detractor feedback. The approach led to a roughly 70% revenue increase and growth to about €4.5M annual revenue within four years.
Manheim
The auto-auction giant collected over 10,000 NPS responses across transactional and relationship surveys in 18 months, identified 110 improvement initiatives, and contacted detractors within 24 hours — one of the most operationally rigorous closed-loop programs documented publicly.
GrooveHQ
The customer-support SaaS sent its first NPS survey to 4,000 users and published a candid post-mortem of what their detractor distribution actually correlated to. Useful as a small-team first-NPS reference.
CustomerGauge benchmark roundup (2025)
Per CustomerGauge’s self-published 2025 SaaS NPS benchmarks, median SaaS NPS sits around +36, with top performers Nutanix (92), Zoom (72), and Google (58). A directional anchor for interpreting your first reading.
Got something to add? Share with the community.