
Storyboard the Solution
In Brief
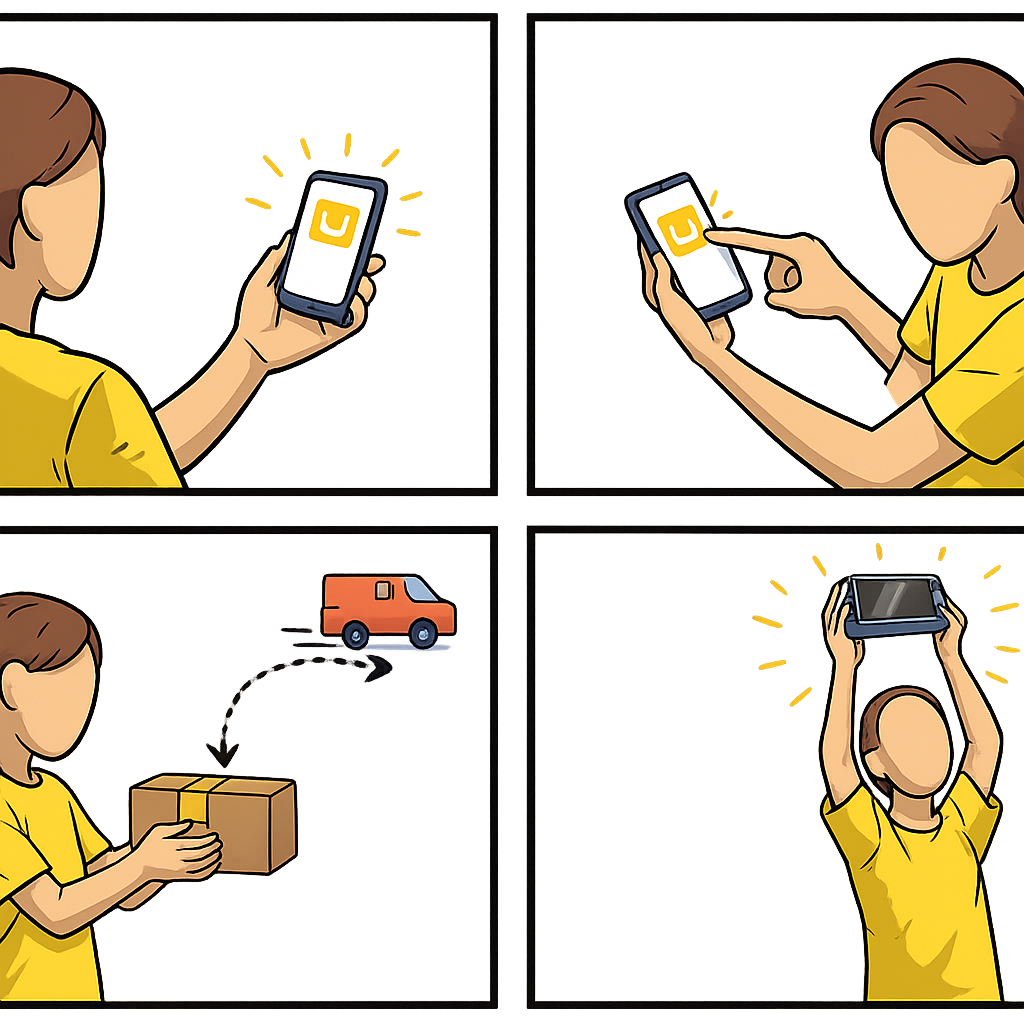
Storyboard the Solution is a visual comic-strip narrative — typically 4 to 8 panels — that illustrates a proposed solution in the context of a customer’s real life. Unlike wireframes or prototypes that show the product in isolation, a storyboard shows the entire user journey: the trigger event, the decision to use the product, the experience of using it, and the outcome. By presenting this narrative to potential customers, you generate qualitative feedback on whether the experience you are describing is one they actually want.
This is a generative method. The goal is not to validate a yes/no hypothesis but to surface confusion, skepticism, excitement, and corrections that refine your understanding of how the solution should work in context. It is the solution-stage companion to Storyboard the Pain, which visualizes the problem before a solution exists.
Common Use Case
You have validated that a problem is real and you have a proposed solution in mind, but you have not yet built wireframes or a prototype. You want to test whether the end-to-end journey — trigger, decision, action, value, outcome — makes sense to customers before committing engineering effort. The output is a corrected storyboard plus a list of customer objections, missing panels, and reframings that should change your design.
Helps Answer
- Does the proposed user experience make sense to customers?
- Is the trigger event realistic — would customers actually seek this solution at that moment?
- Are there steps in the journey that feel confusing, unrealistic, or unnecessary?
- What does the customer expect to happen that the storyboard does not show?
- Does the outcome depicted match what the customer actually wants?
Description
A storyboard forces you to think through the entire user experience, not just the product interface. This is its primary value to the team creating it, even before any customer sees it. Many product concepts fall apart when you try to draw the panel before the user opens the app — the trigger event turns out to be implausible — or the panel after they finish — the outcome turns out to be underwhelming. IDEO’s Design Kit frames a storyboard as “a quick, low-resolution prototype” that helps you visualize a concept from start to finish — the cheapest way to put a whole journey in front of a customer before you build anything.
By showing the storyboard to customers, you move beyond the “would you use this?” question (which always gets a polite yes) to a richer conversation about the specific experience depicted. Customers react to the narrative naturally: “That’s not how it would happen for me,” “I wouldn’t do it at that point, I’d do it when…,” “What happens after this panel? Does it also…?” These reactions are the data you are looking for.
The technique itself goes back to early animation. Disney credited animator Webb Smith with the idea of drawing scenes on separate sheets of paper and pinning them to a bulletin board to tell a story in sequence — the first storyboards — and the first complete storyboards were created for the 1933 Disney short Three Little Pigs. The same logic now anchors product and UX research: a sequence of rough panels exposes narrative leaps that prose, slide decks, and feature lists hide.
Storyboard the Pain is the companion technique. Pain storyboarding visualizes the problem without any solution — a market research tool for understanding and validating the problem space. Storyboard the Solution assumes the problem is validated and visualizes how your proposed solution fits into the customer’s life. Use Storyboard the Pain first, then Storyboard the Solution once you have a concept worth testing.
How to
Prep
1. Define the customer journey you are depicting.
Pick one specific customer segment and one specific scenario. Storyboards fail when they try to show the general case — the panels become abstract and customers cannot react to them. Map the journey as five beats before you start drawing: trigger (the moment the customer notices the problem), decision (the moment they reach for a solution), action (the core interaction with your product), value (the moment they get what they came for), and outcome (what life looks like after). These five beats become the spine of your 4-to-8 panel storyboard.
2. Draft the first and last panels first.
The first panel is the trigger; the last panel is the outcome. Nail these two and the middle panels follow naturally. If the first panel is implausible, no storyboard can save the journey. If the last panel is underwhelming, no feature list will fix the experience.
3. Fill in the middle panels.
Use 2 to 6 middle panels to show how the customer moves from problem to outcome: how they discover the solution, their first interaction with it, the key moment of value delivery, and the transition to the outcome. Each panel should advance the story by one meaningful step.
4. Show the person, not just the product.
Every panel should include the user and their context — at a desk, on the bus, in a meeting. The product is a supporting character, not the star. A storyboard that shows only screens is a wireframe with extra steps; it loses the narrative leverage that makes the method work.
5. Keep the artwork rough and the text sparse.
Stick figures are perfectly effective. Polished illustrations distract customers into commenting on the art rather than the experience. A short caption or thought bubble per panel is enough — the storyboard should be immediately understandable without reading paragraphs of text. AI image generators can produce panels in minutes, but the polish often hurts the conversation; if you use them, ask for sketch-style output and resist the urge to refine.
6. Review internally before you show it to customers.
Show the storyboard to a team member who was not involved in creating it. If they cannot follow the story without explanation, revise for clarity. The storyboard has to stand on its own — in the feedback session, you will not be allowed to narrate it for the customer.
Execution
1. Recruit 5 to 10 customers from the target segment.
You are looking for the same kind of participant you would recruit for a Solution Interview: people who have the problem, in the context the storyboard depicts. Five sessions is the minimum for any pattern to emerge; ten is the point at which corrections start to repeat.
2. Walk through the storyboard one panel at a time.
Show one panel at a time, in order. Ask the participant to narrate what they see — do not explain it yourself first. Their narration is data: where they hesitate, what they assume, what they ignore. After they have described the panel in their own words, ask the two open questions that produce the richest signal:
- “Does this feel realistic? What would actually happen differently for you?”
- “What would you expect to see next?”
Avoid leading questions. Avoid validating their interpretation. Your job is to surface their mental model of the journey, not to defend yours.
3. Observe corrections, extensions, and objections.
Note four classes of reaction in real time:
- Confusion — “What’s happening here?” The panel does not communicate; rewrite or replace it.
- Skepticism — “I wouldn’t do it that way.” The journey beat does not match the customer’s mental model; investigate.
- Excitement — “Oh, that would be great.” The panel resonates; treat as a candidate for the value moment in your messaging.
- Correction — “Actually, the problem for me starts earlier/later.” The customer is rewriting your storyboard for you; capture the rewrite verbatim.
4. Iterate between sessions when corrections converge.
If three customers in a row correct the same panel the same way, revise the storyboard before continuing. The point of running 5 to 10 sessions is to converge on a journey that resonates, not to collect uniform feedback on a fixed artifact. Two to three rounds of iteration typically produce a storyboard that stops generating surprises.
Analysis
The storyboard is generating useful data when customers engage with the narrative — arguing with it, correcting it, extending it. If customers simply nod and say “looks good,” either the storyboard is too vague to react to or the customer is being polite. Push for specifics: “Walk me through your version of panel 3.”
Categorize each correction into one of four buckets, then read the pattern across customers:
- Broken trigger. Customers tell you the trigger event is unrealistic, mistimed, or attached to the wrong emotion. If multiple customers correct the same trigger panel, your go-to-market assumptions may be wrong even if the product is right. Fix the trigger before anything else — every later panel depends on it.
- Missing decision logic. Customers describe a step between the trigger and the action that is not on the storyboard (“first I would check whether…”). Your journey is skipping the part where the customer talks themselves into using the product. Add the missing panel; that is often where adoption actually breaks.
- Feature-set mismatch. Customers want to skip a panel (“I would not need this step”) or ask what happens behind a panel (“does it also…”). The product scope you are depicting is wrong — too much in some places, not enough in others. Tighten the action panels to what the product will actually do at launch.
- Outcome inflation. Customers want the outcome panel to show more than your solution delivers. There is a gap between expectation and product scope, and the storyboard is leaking promises the product cannot keep. Either pull the outcome panel back to what is real, or expand the solution.
A storyboard that produces convergent corrections across all four buckets is telling you the concept is salvageable but the journey needs work. A storyboard where customers repeatedly correct only one bucket — usually trigger or outcome — is telling you to fix that one thing and re-test before changing anything else. A storyboard where customers correct nothing is telling you the panels are too abstract, the artwork is too polished, or the participants are being polite; tighten the panels and recruit a new round.
The highest-leverage solution-design changes are the ones that resolve corrections in the trigger and decision buckets, because errors there propagate through every later panel. Action and outcome corrections are usually local — they change one or two panels, not the whole journey.
- Narrative bias A well-told story is persuasive regardless of whether the underlying product works. Customers may respond to the quality of the storytelling rather than the feasibility of the experience. Use rough sketches to keep the focus on substance.
- Anchoring The storyboard frames the conversation around your proposed journey. Customers may accept the framing rather than imagining alternatives. Ask explicitly: “How would you do this differently?”
- Selection bias Customers who agree to look at storyboards may be more imaginative and open to new products than your general target market. Pair the storyboard sessions with a recruiting screener that does not advertise the topic.
- Single-scenario limitation One storyboard shows one journey for one persona. Do not generalize from a single scenario to all customers. Create multiple storyboards for different segments and trigger events when the corrections in the first round suggest a segment split.
Learn more
Case Studies
Savioke (now Relay Robotics)
Ahead of a hotel pilot with Starwood, Savioke ran a five-day Google Ventures design sprint that storyboarded the end-to-end guest-meets-robot delivery journey frame by frame across the lobby, elevator, and hallway (“guest meets robot, robot gives guest toothbrush, guest falls for robot”). On Friday they walked real hotel guests through the journey — guests called the front desk for a toothbrush and the Relay robot delivered it — validating the personality and interaction design before deploying.
Further reading
- Storyboard — IDEO Design Kit
- Storyboard — Wikipedia
- Storyboards Help Visualize UX Ideas — Nielsen Norman Group
- Knapp, Jake, John Zeratsky, and Braden Kowitz. Sprint: How to Solve Big Problems and Test New Ideas in Just Five Days. Simon & Schuster, 2016. Day 3 of the design sprint is “Storyboard”; the book’s framing of the storyboard as the bridge between sketching and prototyping informs the trigger-to-outcome structure used here.
Got something to add? Share with the community.