Data Mining: A 4-Step Process to Focus Your Analytics Fast
Stop drowning in dashboards and start finding answers.
 By Tristan Kromer·· 8 min read
Quick Answer: To avoid getting lost in data mining, as product managers, we should follow a focused 4-step process: first, use a structured template (like Learn S.I.M.P.L.E.) to define a clear, single-variable research question before touching any analytics tool. Then apply the CCE framework — find Correlations between variables, determine Causation by examining what happens first and why, and Verify with Experimentation using a testable “if this, then that” hypothesis with a pre-defined fail condition.
By Tristan Kromer I get lost in data mining. The sheer volume of numbers, charts, and videos that our analytics stack can produce seems infinite. We’ve got Google Analytics to do the basic stuff, Heap Analytics for pinpoint precision, Ahrefs for SEO positioning, LogRocket for individual user analysis, and internal activation and engagement metrics from our database, which includes a custom categorization of tens of thousands of users by persona type. It’s a lot of data, and there’s the constant risk of being distracted by numbers that seem relevant but don’t lead me to any actionable conclusions. So when I want to make progress on my goal and not disappear into a void of information, I fall back on a 4-step process that keeps me laser-focused on the most useful information:
- Review my Learn S.I.M.P.L.E. template to make sure I’m asking the right questions about the right data. (What am I trying to learn?)
- Conduct my data mining with Correlation, Causation, and Experimentation (CCE):
- Look for Correlation. (What things always seem to happen together?)
- Determine Causation. (Why do they happen together?)
- Verify with Experimentation. (How do these things really interact?)
Download our Learn S.I.M.P.L.E. template

Learn S.I.M.P.L.E.
If I let myself log into Google Analytics without knowing what I’m looking for, I’ll lose half the day. I’ll admit that raw, unguided research can turn up valuable insights, but that’s what data analysts are for — I just want to figure out what drives sales on my site. That’s why I came up with Learn S.I.M.P.L.E. template (Small Insights Mean Progress with Lean Experiments), to make sure I’m drilling in the right area if I want to strike the gold I’m looking for. By asking the right question, deciding what data is relevant, and creating a plan to collect that data, I can drastically reduce the time wasted passively bouncing around in the information. 
Ask the right question
The first step is to make sure you’re asking the right question. Entrepreneurs have their time spread thin enough already. It’s important to remain focused. So we have to make the question we are trying to answer clear at the start. This could be a specific yes/no (closed-ended) question like “Is the new conversion funnel performing better than the old one?” Or it could be something general and open-ended, such as “How are people navigating our website?” Clearly defining the question will save time and headaches later. It’s a crucial first step down the correct path to find the information you want, and it’s easy to achieve with a few simple grammatical choices.
Avoid conjunctions
Conjunctions tend to make questions too complex and unsolvable. The word “and” usually indicates you are introducing multiple variables into the question, which makes it harder to answer.
- How can we increase our conversion rate AND our market valuation?
- If we change the value proposition AND the channel, will that appeal to our customer?
- Should we explore expansion AND a franchise plan?
There are situations where we must deal with complex, multivariable problems, but they are less common than you think. You should only explore these questions once you’re done solving as many simple questions as possible.
Avoid complex nouns
Another way to slip in multiple variables is to use complex nouns. In my office hours, I always ask the startup What are you trying to learn? The answer that comes back is often something along the lines of Is this the right business model? “Business model” is a complex noun, composed of at least 9 different elements as represented on the Business Model Canvas. It’s a very complex noun, and one experiment or data-analysis session is not going to validate or invalidate the entire business model at once. 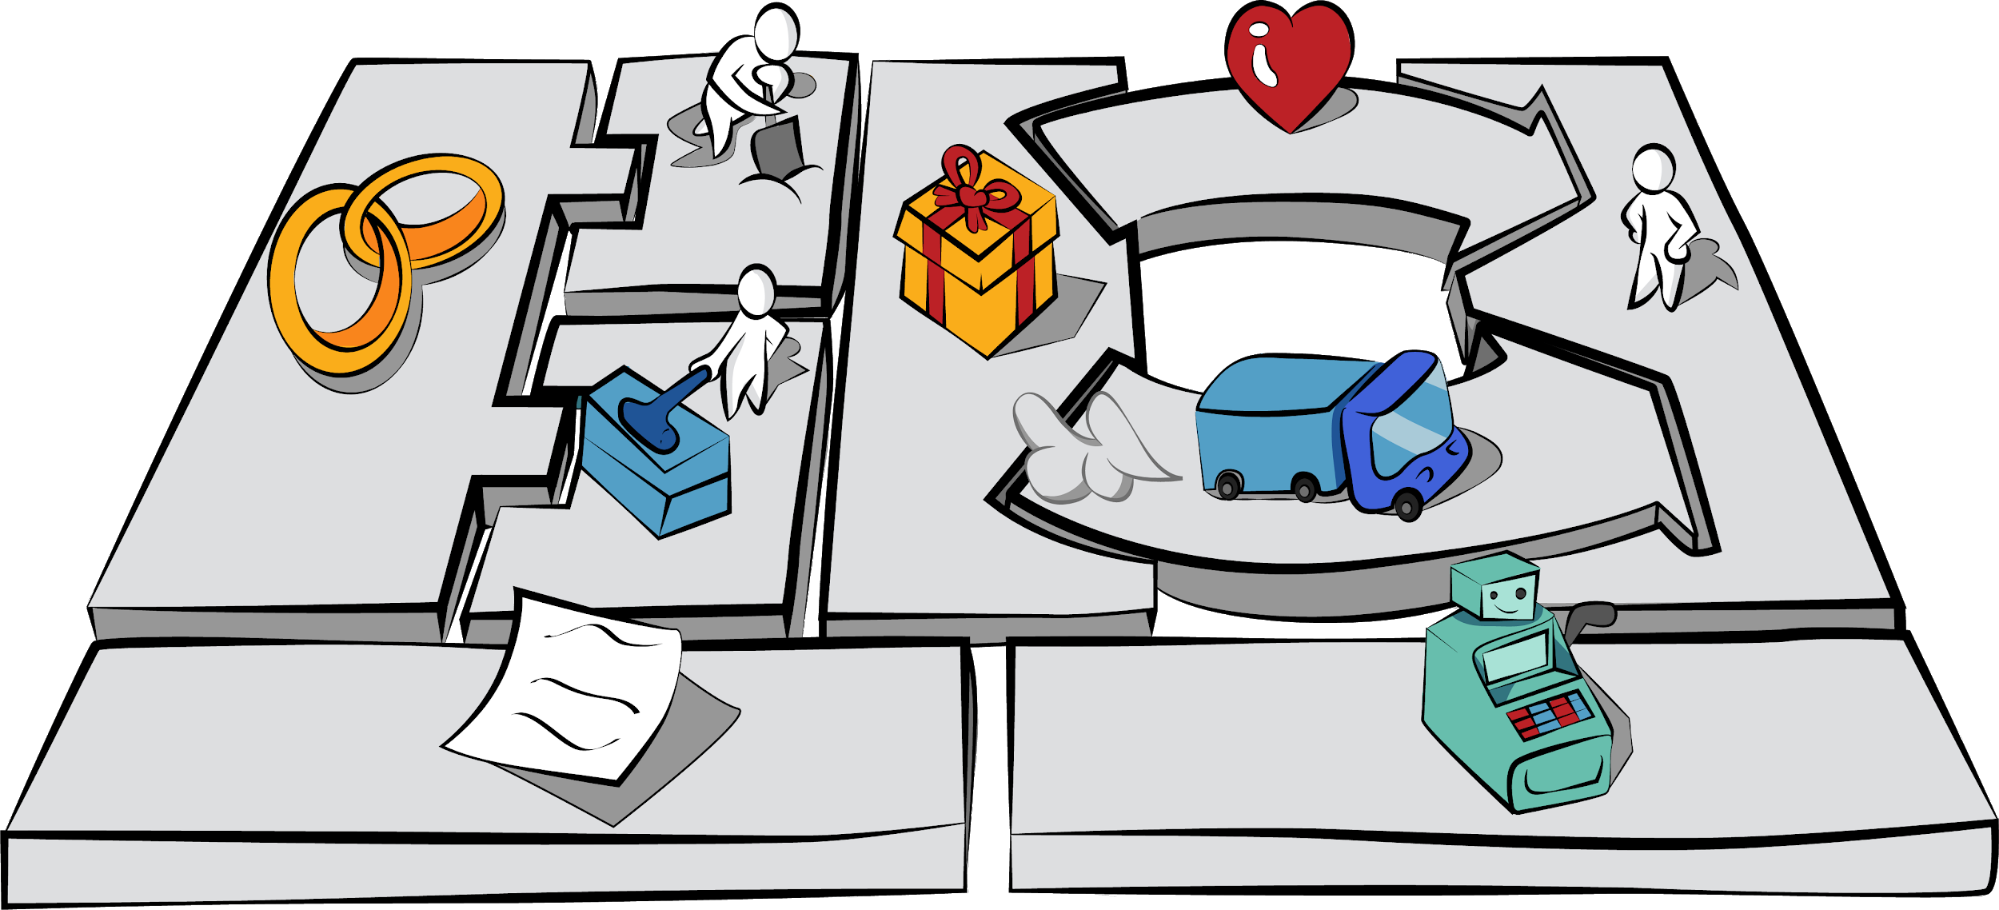 Try to atomize your research question so there is only one, indivisible thing to investigate.
Watch for sneaky hypotheses
“Or” is another potentially lethal conjunction, often leading us to a false choice from a binary set of options. When we ask if the killer is Colonel Mustard or Mrs. Peacock, we are subconsciously discounting the butler. While we can use “or” when asking which version of a landing page is performing better, it often restricts our vision to the most obvious solutions, leading us to overlook more interesting possibilities. This is different from a yes/no question. “Is this landing page performing better than the old one?” Either a yes or a no leaves open the possibility that there is a better solution out there.
Narrow the data mining
Once we have the question, we have to then figure out what data would be helpful. This is a phenomenal time saver. If I’m trying to determine which conversion funnel is best, then Heap Analytics is great at this. If I’m trying to determine the typical navigation path through our website, then Google Analytics has tools specifically for that analysis. It’s helpful to think in plain terms about who has the data we need. If I need to analyze the behavior of my users by customer persona, then neither Google Analytics nor Heap has that information. It’s stored in our own database, so I may have to do the analysis myself in a spreadsheet. Each tool has its strengths and weaknesses. Getting familiar with our analytics tools can be a bit time-consuming in and of itself, but it will pay dividends down the line.  (Note: I do recommend using a catch-all tool like Heap Analytics. Some tools only collect data on what you tell them to. If you make a mistake and misconfigure your funnel, the data is lost. Heap tracks everything and allows you to reconfigure your funnel after the fact.)
Focus your data mining with CCE
If your question from the Learn S.I.M.P.L.E. template is open-ended, you are going to need to do some data mining. This means digging around for information you’re not sure how to find. But you can narrow the search area by clearly defining the data you want to look at. I’m not a data scientist. I like numbers and I know enough statistics to be dangerous to myself, but I’m not going to be manually running multivariate analyses of A/B tests. So when it comes to the plan, I keep it as simple as possible:
- Look for Correlation.
- Determine Causation.
- Verify with Experimentation.
Correlation
What two things always seem to happen together?
- Ice cream sales go up when the weather gets hotter.
- More people drown in the summer.
- It is hotter in the summer.
- Ice cream sales go up when more people drown.
All of these things are true, but at this point we have no idea how they are connected. To see if any of these events are caused by another, we need to dig deeper.
Causation
Do ice cream sales go up because people are drowning? Is there a morbid fleet of ice cream trucks out there that strategically park outside funeral homes to console the mourners? Mmmmmm, no. A more logical association is seasonality — summer means ice cream and swimming (have you ever seen an ice cream truck cruising the streets in December?) In the summer people eat more ice cream and more people go swimming. One does not cause the other.  When there is a causal relationship, the thing that happens first is usually the cause. People don’t start consuming more ice cream and then the sun notices and burns a little hotter. Summer happens, then ice cream and drownings follow. If people who download something on your site are subscribing to your newsletter, check to see which happens first. Do they download and then get prompted to subscribe? Or do they subscribe and then get notified of a download? The thing that happens first is probably the cause, but that doesn’t mean you should stop digging. There may be something that happens even earlier that influences the other events.
Experimentation
Once you’ve identified potential causation, that is the hypothesis that must be tested. Then you can modify your product or service to impact that cause and see if the effect follows.  If we did believe that eating ice cream causes more drownings, we could simply give away free ice cream and see if drownings increase. Or we could horde all the ice cream and see if drownings stopped altogether. Either scenario gives us a clear and testable “IF this THEN that” prediction. While a data scientist can make high-confidence statements with good data analysis, mistakes do happen, and it’s always safer to confirm the analysis. So break out the Learn S.I.M.P.L.E. or Learn S.M.A.R.T. template and define a more rigorous experiment with a clear prediction and pre-defined fail condition that would invalidate the hypothesis.
Lessons Learned
- Look for correlation between variables.
- Determine causation to form a testable hypothesis.
- Verify with experimentation.
Special thanks to Kenny Nguyen and Krsto Arsenijevic for reviewing and giving feedback on this post.
Download our Learn S.M.A.R.T. template
Frequently Asked Questions
How do I avoid getting lost in data mining?
Start by clearly defining what you’re trying to learn before opening any analytics tool. We recommend using a structured template like Learn S.I.M.P.L.E. (Small Insights Mean Progress with Lean Experiments) to formulate a focused research question, identify what data is relevant, and plan how to collect it. This prevents aimless browsing through dashboards that wastes half your day.
What’s the difference between correlation and causation in data mining?
Correlation means two things happen together — like ice cream sales and drowning rates both rising in summer. Causation means one event actually drives the other. As product managers, we need to dig deeper than surface-level patterns. A good rule of thumb: the event that happens first is usually the cause, but always verify through experimentation before acting on assumptions.
How should I frame the right research question for analytics?
Keep your question focused on a single variable. Avoid conjunctions like “and” or “or,” which introduce multiple variables and make questions unsolvable. Also watch for complex nouns — asking “Is this the right business model?” is really nine questions in one if you consider the Business Model Canvas. Atomize your question so there’s only one indivisible thing to investigate.
What is the CCE framework for data analysis?
CCE stands for Correlation, Causation, and Experimentation. First, look for variables that consistently appear together. Then determine whether one actually causes the other by examining which occurs first and whether the relationship is logical. Finally, verify your hypothesis through a controlled experiment with a clear “if this, then that” prediction and a pre-defined fail condition.
How do I choose the right analytics tool for data mining?
Match the tool to your question. If you’re comparing conversion funnels, a precision tool like Heap Analytics works well. For understanding navigation paths, Google Analytics has dedicated features. For persona-based analysis, you may need your own database. We also recommend using a catch-all tool like Heap that tracks everything automatically, so you don’t lose data if you misconfigure your setup.

Comments
Loading comments…
Leave a comment