Business Forecasting: Why Averaging Best and Worst Cases Fails
The math error hiding in your spreadsheet that nobody checks
 By Tristan Kromer·· 7 min read
Quick Answer: The most common business forecasting error is averaging best-case and worst-case outputs (e.g., revenue), which systematically overestimates returns because business models rely on multiplication—a non-linear operation. As product managers, we should instead average the inputs (units sold, unit price, etc.) separately or, better yet, use a Monte Carlo simulation that runs thousands of randomized trials to reveal the true expected value and the probability of losing money.
By Tristan Kromer The worst error I’ve seen in a business plan – and I’ve seen it a lot – is one of basic math. It is an unforced error that too many companies make. I’m referring to the Best Case / Worst Case analysis. In theory, it is just estimating the best-case scenario and the worst-case scenario, and then averaging the two. Seems pretty simple, right?
- Best case: $3,000,000
- Worst case: $1,000,000
- Average: $2,000,000
Startups are smart enough to avoid discussing the worst-case scenario, so they typically avoid this error. But corporate innovation projects fall into this trap more often than necessary. Here’s why.
The Absence of Likelihood
The first issue with this simplistic thinking is that the best-case scenario is rarely as likely as the worst-case scenario. For a typical startup, the worst-case scenario is zero revenue and you lose anything you invested. The best-case scenario is you IPO for a billion dollars and hop on a rocket ship to Mars. Guess which one is more likely. The best-case scenario is limited by your imagination. The worst-case scenario is limited by the amount of money your investors are willing to gamble on you. There is only so much damage you can do in the worst-case scenario. So simply averaging the two is shoddy math. To make an accurate business forecast, you need to weigh the probabilities of success and failure across the possible outcomes.  A more realistic calculation would be:
- Best case: $1,000,000,000
- Worst case: -$1,000,000
- Likelihood of best case: 0.001%
- Likelihood of worst case: 99.999%
- Probability Weighted Expected Outcome: ($1,000,000,000 * 0.0001%) + (-$1,000,000 * 99.9999%) = ($100,000 - $999,999) = -$899,999
This slightly improved calculation shows that this probably isn’t a good investment. But it’s still a bad estimation because there is a huge range of possible outcomes between losing one million and earning one billion.
Shoddy Math
Now let’s try averaging the output of a slightly more complex calculation. Instead of best-case and worst-case profit/loss scenarios, let’s look at the best-case and worst-case scenarios of various inputs to profit/loss, such as units sold, unit price, and cost of investment. For simplicity’s sake, let’s also assume (beyond all reason) that the best and worst cases are equally likely, and an average of the two will be just fine from a probability perspective: Inputs to profit/loss: Units Sold x Unit Price = Revenue
- Best Case:
- 100,000 x $10 = $1,000,000
- Worst Case:
- 20,000 x $5 = $100,000
- Average: ($1,000,000 + $100,000) / 2 = $550,000
- Cost of investment = $500,000
In this scenario, your $500,000 earns you $50,000, or 10%. Sounds like a good investment? If we did the math that way and simply averaged the best case and worst case, it would seem so. But this is incredibly wrong.  Even in this simple example, if we average the inputs of each scenario instead of the output, we get a different answer: Inputs to profit/loss: Units Sold x Unit Price = Revenue
- Units Sold x Unit Price = Revenue
- Average of Units sold = 100,000 + 20,000 / 2 = 60,000
- Average Unit Price = $10 + $5 / 2 = $7.50
- 60,000 x $7.50 = $450,000
- Cost of investment = $500,000
In this scenario, your $500,000 loses you $50,000, or -10%.  If this seems weird to you, you’re not alone. It seems like averaging the inputs and the outputs should result in the same answer, but that’s not the case. The issue is that multiplying two numbers together is not a linear equation. Increasing the inputs by one increases the output by more than one. Unfortunately, human brains are very bad at non-linear equations, which can make your business forecasting useless.
Non-Linear Equations
We can understand how this works with a simple example. If I roll 2 six-sided dice and add them together, what would the average be? All I have to do is take the lowest number I can roll (1 + 1) and average it with the highest number I can roll (6 + 6).
- 1 + 1 = 2
- 6 + 6 = 12
- (2 + 12) / 2 = 7
For a simple linear equation, this is exactly right. If I take two dice, roll them about 30,000 times, and plot the number of times we get each result from 2 to 12, we’ll see something that looks like the bell curve we might remember from statistics class. 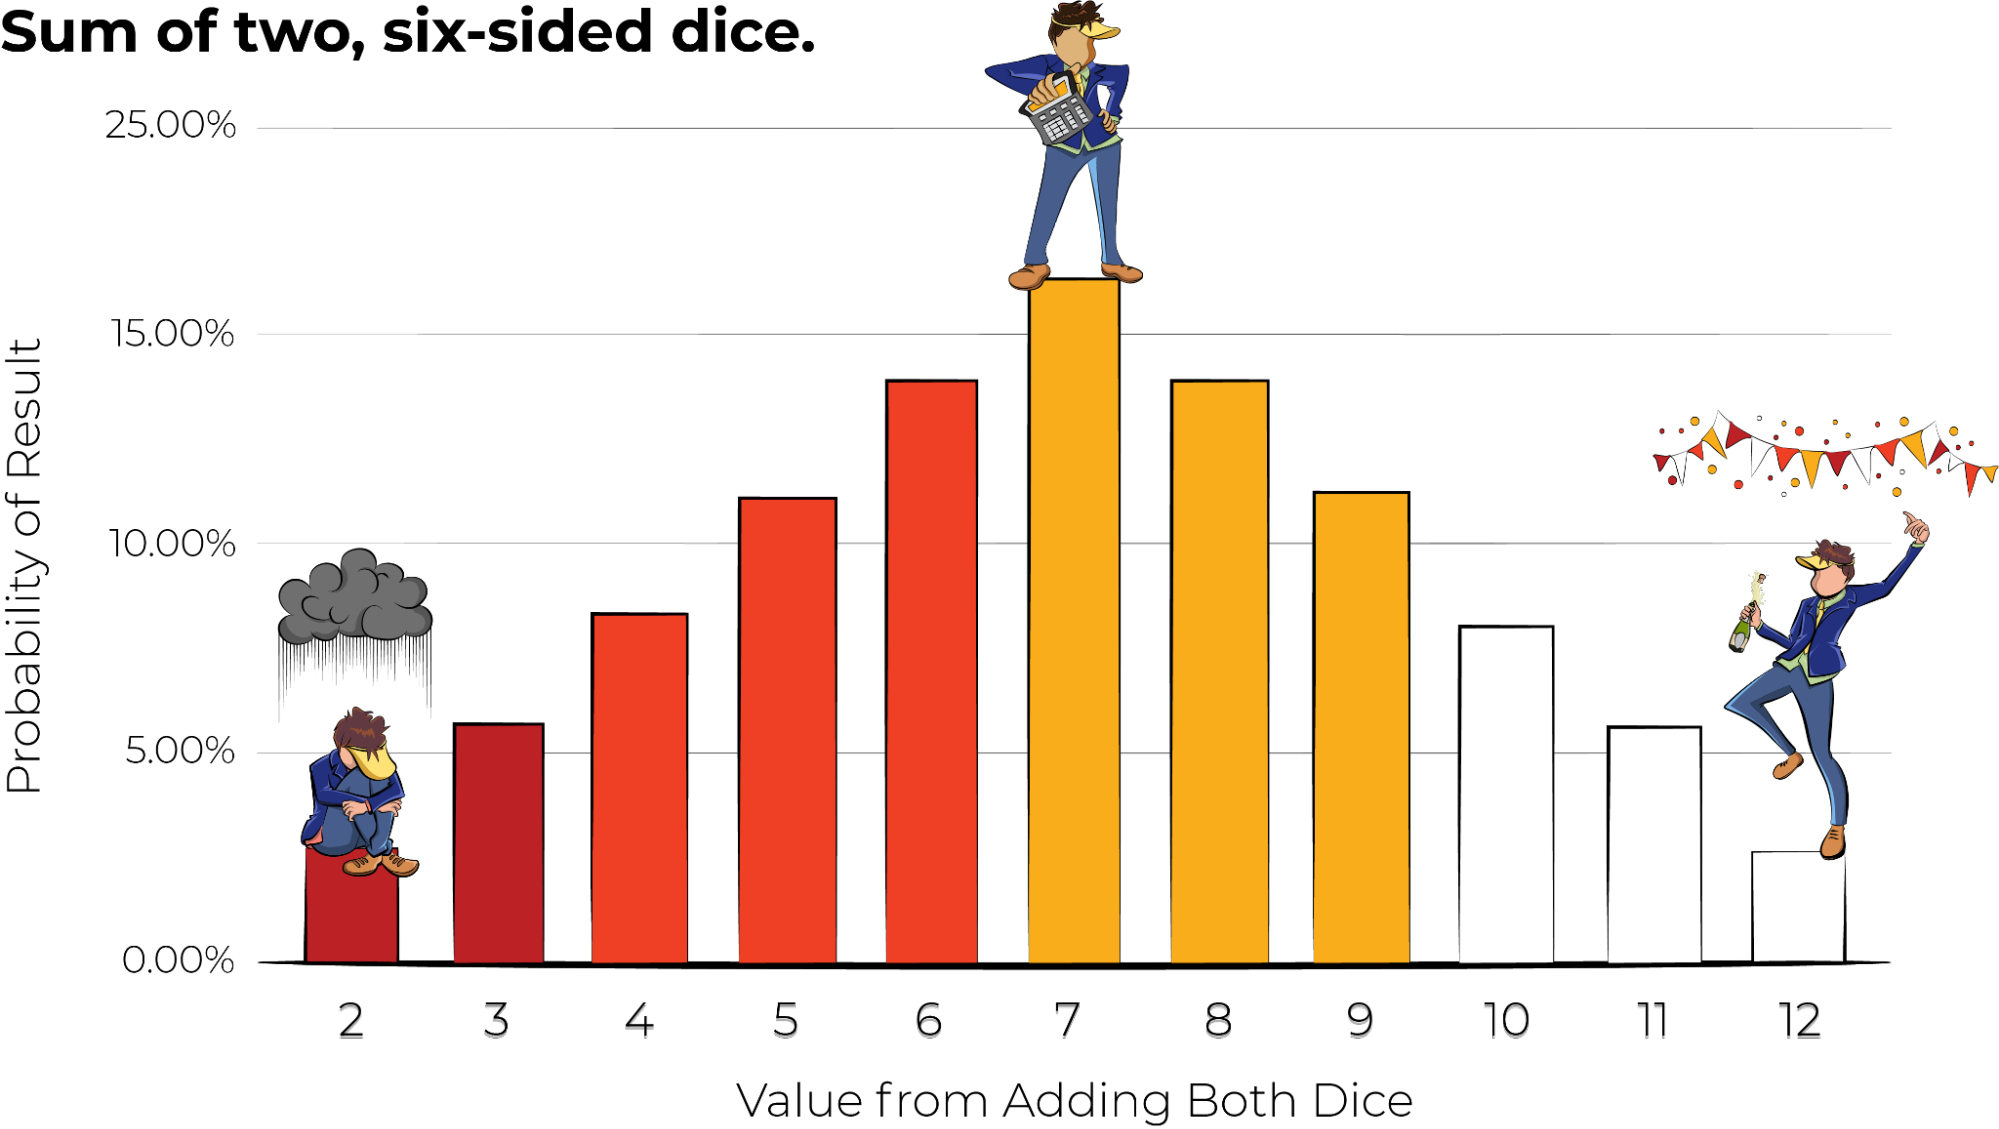 The chart looks completely symmetrical. The most likely outcome is 7, and the best outcome (12) and worst outcome (2) are equally likely. So our best-case / worst-case approach works quite well here. Now, if I roll two 6-sided dice and multiply the output, what would the average be? Using best-case / worst-case approach, this would be:
- 1 * 1 = 1
- 6 * 6 = 36
- 1 + 36 / 2 = 18.5
But if I roll the dice another 30,000 times and plot the results, we see something quite different. 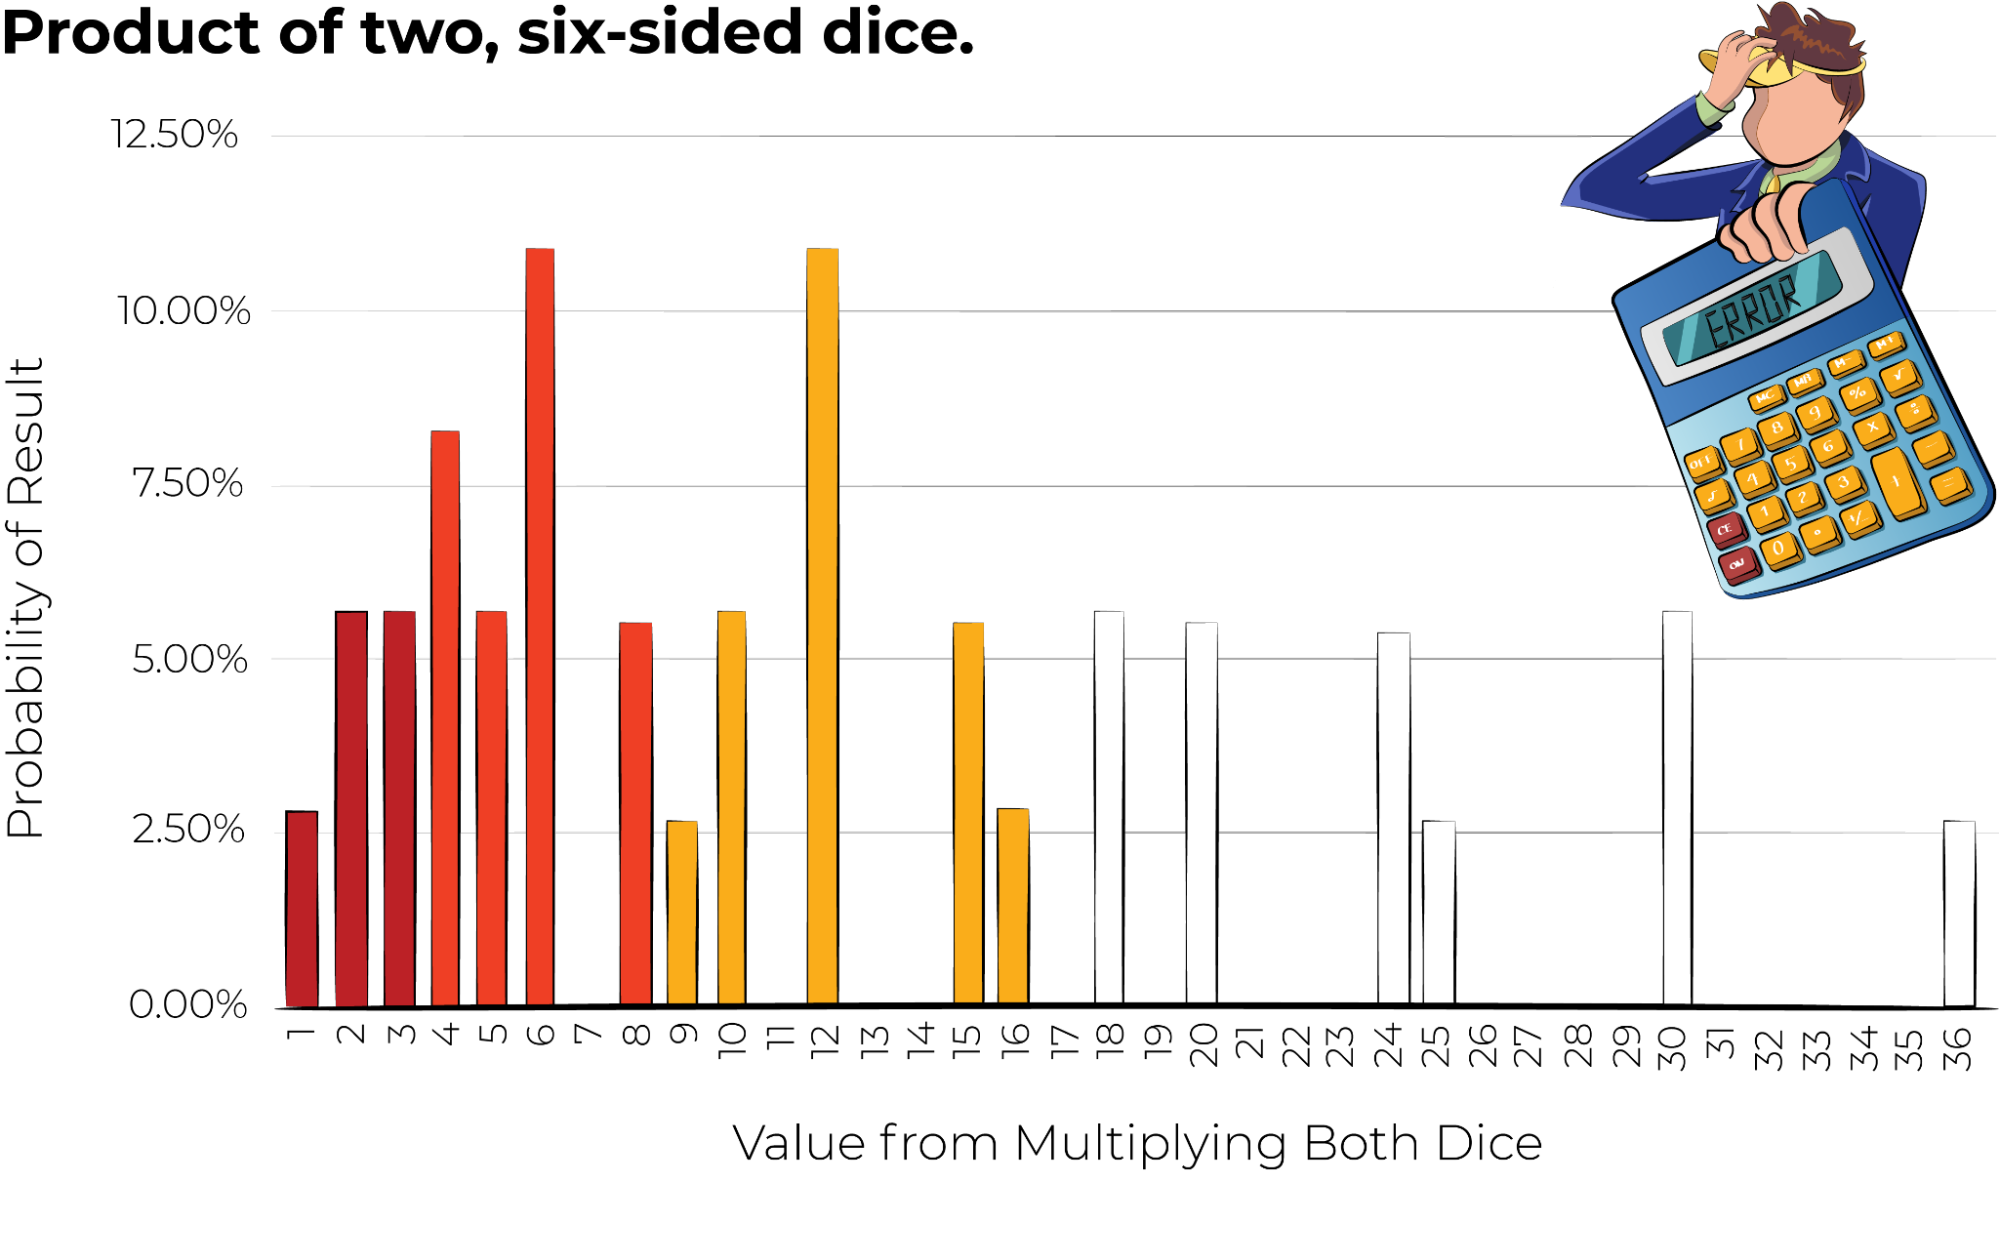 This chart looks flat-out weird. It’s not symmetrical, and it doesn’t look like anything we remember from statistics class. It even has gaps. This makes sense, because there’s no two numbers between 1 and 6 that you can multiply to get a number like 7, 11, 13, and so forth. This equation is very non-linear. The most likely result is either 6 or 12, and if we calculate the average expected value, it would be close to 12, not the 18.5 we predicted with our best-case / worst-case approach. Since every business case uses multiplication, division, or exponents, it should not be shocking that most business cases wildly overestimate the forecasted ROI.
The Finance Department
How is such an obvious mistake possible? No finance department would ever make this mistake in their business forecasting, right? It’s true, a well-trained finance department is not going to fall for these types of math errors – if they actually look for them. But the examples above are simple. Real business forecasting spreadsheets can include dozens of variables, and are given to innovation teams with zero financial training. Finance teams and executives often don’t have time – or don’t bother – to drill into the details of a business forecast and see how they are calculated. They simply look at the output. So if somewhere in that spreadsheet, someone has taken a shortcut and done a best/worst-case average, that error is hidden in the final result. Garbage in, garbage out.
Monte Carlo
A better approach to calculating the expected outcome of a business case is to average the inputs. This will prevent the overestimation of the best-case / worst-case approach we get when we average the outputs. But a more nuanced approach is to just roll the dice. As we did above with our pair of dice, we can simply throw random numbers between our best and worst cases and see what actually happens. This is called a Monte Carlo Simulation. Using this approach, you can not only figure out the expected value of a business plan, but can also calculate the likelihood of achieving a minimum revenue target that is above your investment level. In other words, you can calculate the odds you’ll lose money. You can even do fancier things, such as calculate the value of running an experiment to reduce the level of uncertainty in one of the variables. You can even tell which variable is the most important one to focus on. In other words, you could tell your innovation team to focus on experiments to determine the retention rate of your customers instead of messing around with the home page design. If you want a deeper dive on the value of information, check out Douglas Hubbard’s book How to Measure Everything, and see how properly calculated data can make your decisions for you. Math can prioritize your product roadmap more than a RICE score ever will.
Lessons Learned
- Math is hard.
- Don’t average the output of a best-case / worst-case business forecast.
- Use a Monte Carlo simulation for your business forecasting.
Frequently Asked Questions
Why is averaging best-case and worst-case scenarios a bad approach to business forecasting?
Simply averaging best-case and worst-case outputs ignores two critical factors: the likelihood of each scenario and the non-linear math involved. The worst case is almost always far more likely than the best case, and because business models use multiplication (units sold × unit price), averaging outputs produces a systematically inflated estimate. As product managers, we need to average the inputs or use simulation methods instead.
What is a Monte Carlo simulation and how does it improve business forecasts?
A Monte Carlo simulation works by running thousands of random trials using values between your best and worst cases for each input variable. Instead of relying on a single average, it shows the full range of probable outcomes, letting you calculate the expected value and the likelihood of hitting a minimum revenue target. It can even reveal which variable is most important to de-risk through experiments.
Why do corporate innovation teams make business forecasting errors more often than startups?
Startups typically avoid best-case/worst-case analysis altogether, but corporate innovation projects frequently use complex spreadsheets with dozens of variables—often handed to teams with zero financial training. Finance departments may not drill into the details of how each cell is calculated, so a hidden shortcut like averaging best and worst outputs can silently inflate the final result. It’s a classic garbage in, garbage out problem.
How does non-linear math cause overestimation in a business forecast?
Business cases rely on multiplication, division, and exponents—all non-linear operations. When you multiply two variables, increasing inputs by one unit increases output by more than one unit. As the article demonstrates with dice, averaging the outputs of a multiplication (1×1 and 6×6) gives 18.5, but the actual expected value is closer to 12. This means most business cases that average outputs systematically overestimate forecasted ROI.
What’s the difference between averaging inputs vs. outputs in a business forecast?
Averaging outputs takes the final revenue numbers from best and worst cases and splits the difference—which in the article’s example showed a 10% gain. Averaging the inputs (units sold, unit price) separately and then calculating revenue showed a 10% loss on the same investment. The difference comes from the non-linear relationship between multiplied variables, making input averaging significantly more accurate.

Comments
Loading comments…
Leave a comment