
Net Promoter Score Survey
In Brief
The Net Promoter Score (NPS) identifies customer loyalty to the brand or product. The survey uses a score from 0 to 10 to answer the question: “How likely is it that you would recommend [company X or product Y] to a friend or colleague?”
NPS was first introduced by Frederick F. Reichheld in a Harvard Business Review article, “The One Number You Need to Grow.”
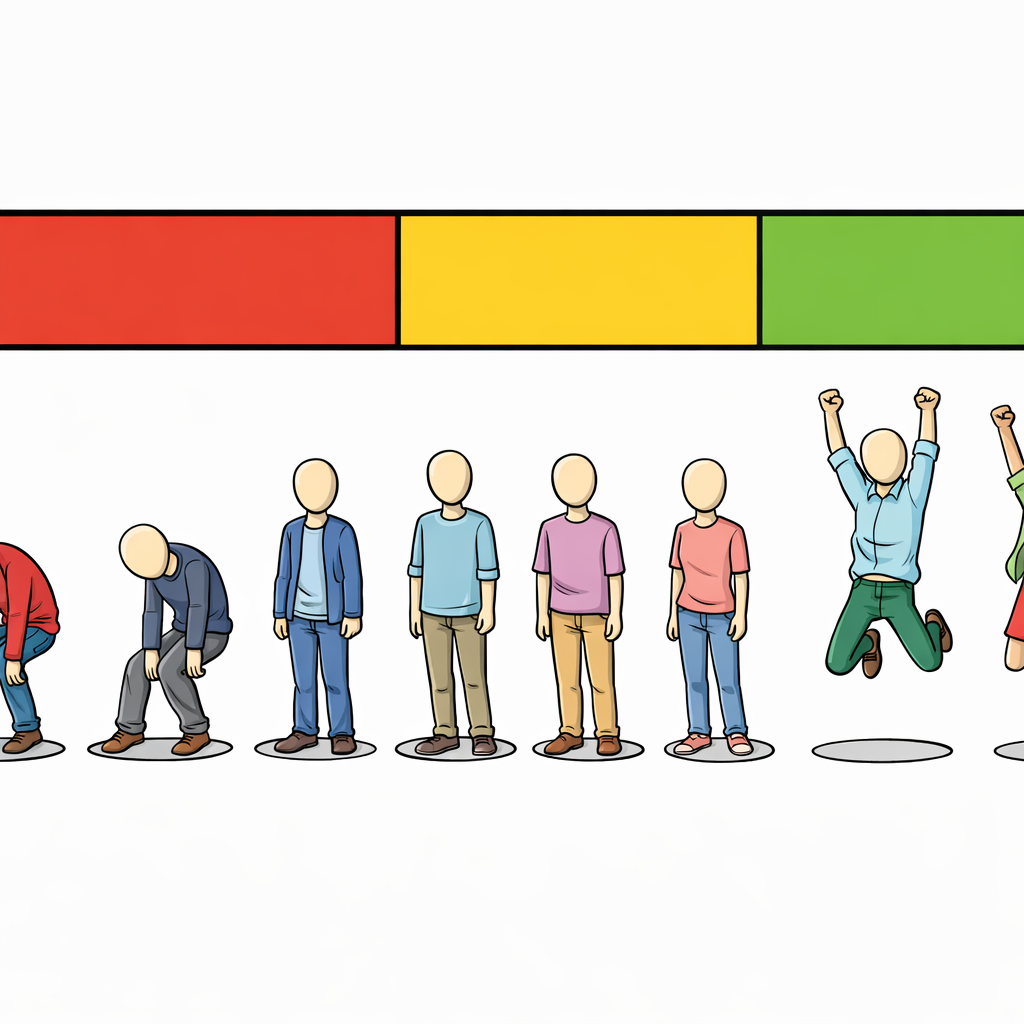
People who give a score from 9 to 10 are considered “Promoters.” People who give a score from 7 to 8 are considered “Passives,” meaning those who are satisfied but not very loyal to our brand or product. People who give a score from 0 to 6 are considered “Detractors.”
The NPS question can be followed up with another question to find out the reason(s) for the score the customer gave. By doing so, the Net Promoter Score can be associated with both qualitative and quantitative results.
Helps Answer
- What is our customer loyalty rate?
- How do we segment our customers to promote the product/services?
- Who are the brand ambassadors among our customers?
Tags
- B2C
- B2B
- Customer
- Relationship
- Value proposition
- Quantitative
- Qualitative
Description
NPS tracks loyalty and can identify the ambassadors among your customers. It is commonly used as a simple customer satisfaction metric.
The NPS is not just one question, but rather a group of questions probing to understand the customer’s feeling or loyalty towards the company, product, or service.
By understanding the reasons of the scores, you can determine how many people will become ambassadors. It can also determine where your company, product, or service stands in word-of-mouth marketing.
Time Commitment and Resources
The survey can be sent to all customers at one time. The results can be compiled and analyzed in about a week. NPS surveys can be sent every six months or every year to determine changes as well.
How to
An NPS survey is simple and straightforward. You can use third-party survey companies such as Survey Monkey or traditional pen-and-paper methods. You can even just send the question via email to your customers directly.
Many companies send NPS questions together with other survey questions to save time and resources.
Interpreting Results
Loyalty economics can be calculated by understanding the reasons why customers are loyal to (or recommend) your company, product, or service.
While there are some variances in the interpretations of an NPS result, the original NPS score calculation is achieved by subtracting the percentage of respondents that are labeled “Detractors” from the percentage of respondents that are labeled “Promoters”:
NPS = % of Promoters – % of Detractors
However, interpreting the scores is only half the benefit of the NPS questionnaire. The second part of the “Why” question is equally important — if not more important — than the actual NPS itself. Understanding the reasons why your customers may or may not promote your company, product, or service can lead to breakthrough insights.
By understanding the “Why” components of NPS surveys better, you can identify which customer segments are more valuable and what they want more from your company, product, or service. Moreover, you can identify the reasons certain customer segments become detractors or passives.
Potential Biases
The timing of sending the NPS questionnaire to customers can lead to biased results. For example, if you sent out the survey shortly after you have upset several customers, they will not give high scores. Likewise, if you have recently made several customers happy, they will rate your customer, product, or service higher.
Field Tips
- Got a tip? Add a tweetable quote by emailing us: [email protected]
Case Studies
- GrooveHQ - Lessons Learned Sending a Net Promoter Survey to 4,000 Users
- Zendesk - Measure customer loyalty with Net Promoter Score surveys in Zendesk
- Got a case study? Add a link by emailing us: [email protected]
Tools
- Got a tool to recommend? Add a link by emailing us: [email protected]
References
- Survey Monkey - Net Promoter® Score (NPS) Survey
- Bain & Company - The Economics of Loyalty - Loyalty Insights #3
- Zendesk - NPS Best Practices: The Most Effective Way to Send a Net Promoter Score
- Qualtrics - Net Promoter® Score System Questions Answered
- .Got a reference? Add a link by emailing us: [email protected]